ISRO’s Bhuvan NTL portal provides pre-aggregated mean radiance for all Indian states from 2012 to 2024, and WMS raster tiles for any custom region, with no authentication required.
All states, all years
library(lightson)

df <- bhuvan_stats()
#> Warning: Your request spans a collection break in the Bhuvan NTL data:
#> 2012-2023 uses VNP46A4 Collection 1.0 and 2024 onwards uses Collection 2.0.
#> Radiance estimates are not directly comparable across this boundary. Treat any
#> 2023-to-2024 trend as an artefact of the collection change, not a real-world
#> signal.
dim(df)
#> [1] 481   3
head(df)
#>               state year mean_radiance
#> 1 Andaman & Nicobar 2012          2.28
#> 2    Andhra Pradesh 2012         12.05
#> 3 Arunachal Pradesh 2012          0.78
#> 4             Assam 2012         10.81
#> 5             Bihar 2012          8.36
#> 6        Chandigarh 2012       1100.69
Single state time series
bihar <- bhuvan_stats(state = "BIHAR")
#> Warning: Your request spans a collection break in the Bhuvan NTL data:
#> 2012-2023 uses VNP46A4 Collection 1.0 and 2024 onwards uses Collection 2.0.
#> Radiance estimates are not directly comparable across this boundary. Treat any
#> 2023-to-2024 trend as an artefact of the collection change, not a real-world
#> signal.
bihar
#>    state year mean_radiance
#> 1  Bihar 2012          8.36
#> 2  Bihar 2013          9.12
#> 3  Bihar 2014         12.18
#> 4  Bihar 2015         16.45
#> 5  Bihar 2016         22.05
#> 6  Bihar 2017         24.64
#> 7  Bihar 2018         35.56
#> 8  Bihar 2019         41.00
#> 9  Bihar 2020         41.43
#> 10 Bihar 2021         47.97
#> 11 Bihar 2022         55.75
#> 12 Bihar 2023         60.59
#> 13 Bihar 2024         79.68
library(ggplot2)
plot_ntl_trend(bihar,
  region = "Bihar",
  caption = "Source: ISRO Bhuvan NTL portal"
)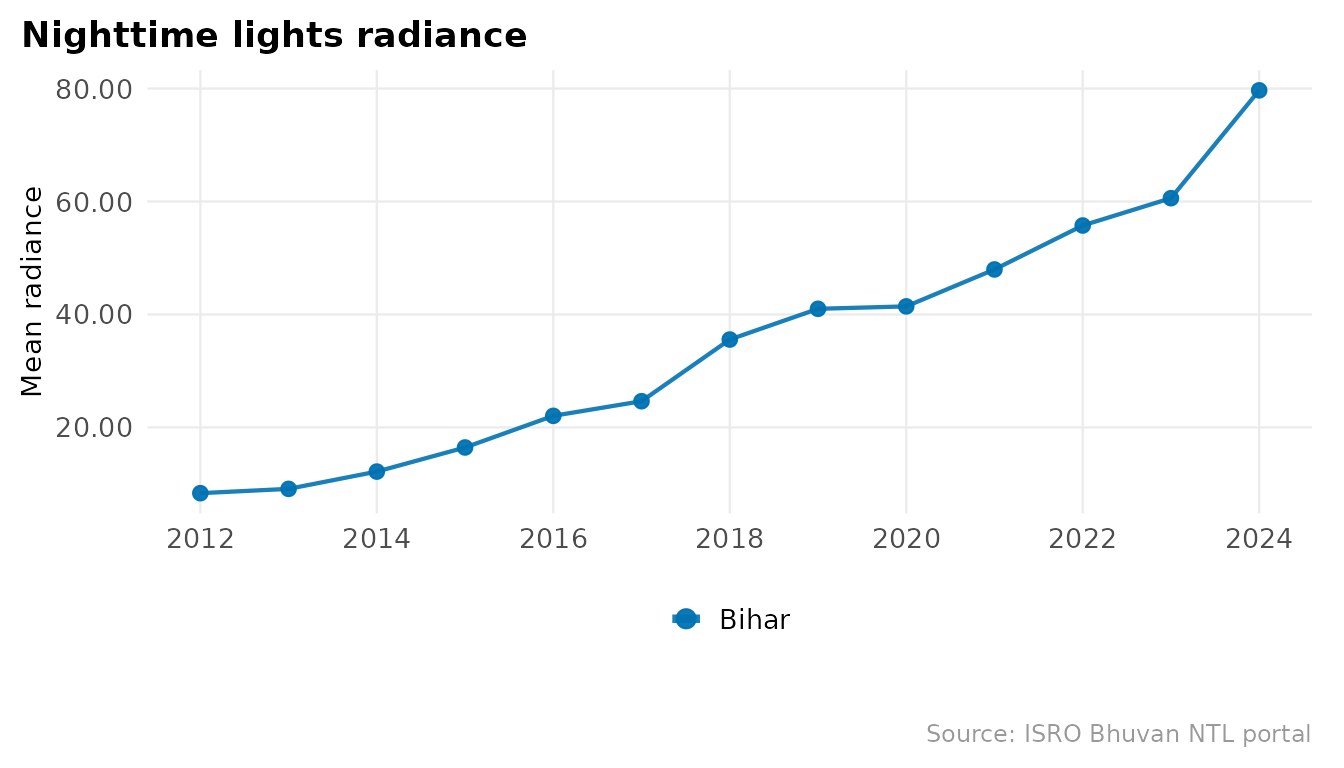
Radiance nearly 10x from 2012 to 2024.
Compare states
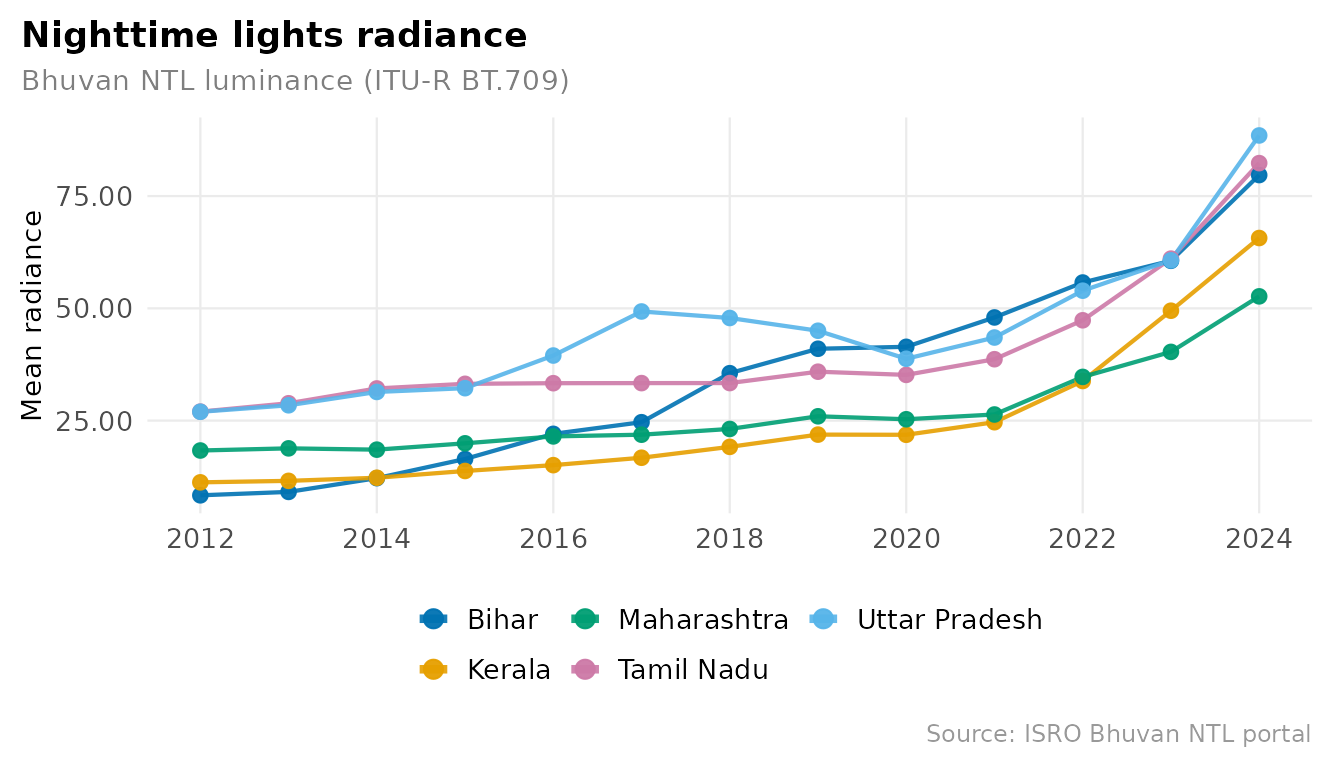
states <- c("Bihar", "Maharashtra", "Tamil Nadu", "Uttar Pradesh", "Kerala")
plot_ntl_trend(
  df[df$state %in% states, ],
  region   = states,
  subtitle = "Bhuvan NTL luminance (ITU-R BT.709)",
  caption  = "Source: ISRO Bhuvan NTL portal"
)
Nighttime India from space, 2012 to 2024
states_sf <- get_india_admin("state")

years_sel <- c(2012, 2015, 2018, 2021, 2024)
rasters <- bhuvan_raster("IND", years = years_sel, bbox_pad = c(0, 0, 0, 3.5))
#> Warning: Your request spans a collection break in the Bhuvan NTL data:
#> 2012-2023 uses VNP46A4 Collection 1.0 and 2024 onwards uses Collection 2.0.
#> Radiance estimates are not directly comparable across this boundary. Treat any
#> 2023-to-2024 trend as an artefact of the collection change, not a real-world
#> signal.
#> Cached as: /home/runner/.lightson/cache/gadm/gadm41_IND_0_pk.rds
#> Downloading Bhuvan WMS: year 2012 ...
#> Downloading Bhuvan WMS: year 2015 ...
#> Downloading Bhuvan WMS: year 2018 ...
#> Downloading Bhuvan WMS: year 2021 ...
#> Downloading Bhuvan WMS: year 2024 ...

if (length(rasters) == 0) stop("No rasters downloaded. Check network / Bhuvan WMS.")
plot_ntl_panel(
  rasters,
  polygons = states_sf,
  title    = "India at night, 2012 to 2024",
  subtitle = "Bhuvan NTL luminance (ITU-R BT.709). Boundaries: LGD/SoI.",
  caption  = "Source: ISRO Bhuvan NTL portal",
  ncol     = 3L
)
#> Warning: Raster pixels are placed at uneven horizontal intervals and will be shifted
#> ℹ Consider using `geom_tile()` instead.
#> Raster pixels are placed at uneven horizontal intervals and will be shifted
#> ℹ Consider using `geom_tile()` instead.
#> Raster pixels are placed at uneven horizontal intervals and will be shifted
#> ℹ Consider using `geom_tile()` instead.
#> Raster pixels are placed at uneven horizontal intervals and will be shifted
#> ℹ Consider using `geom_tile()` instead.
#> Raster pixels are placed at uneven horizontal intervals and will be shifted
#> ℹ Consider using `geom_tile()` instead.
#> Raster pixels are placed at uneven horizontal intervals and will be shifted
#> ℹ Consider using `geom_tile()` instead.
#> Raster pixels are placed at uneven horizontal intervals and will be shifted
#> ℹ Consider using `geom_tile()` instead.
#> Raster pixels are placed at uneven horizontal intervals and will be shifted
#> ℹ Consider using `geom_tile()` instead.
#> Raster pixels are placed at uneven horizontal intervals and will be shifted
#> ℹ Consider using `geom_tile()` instead.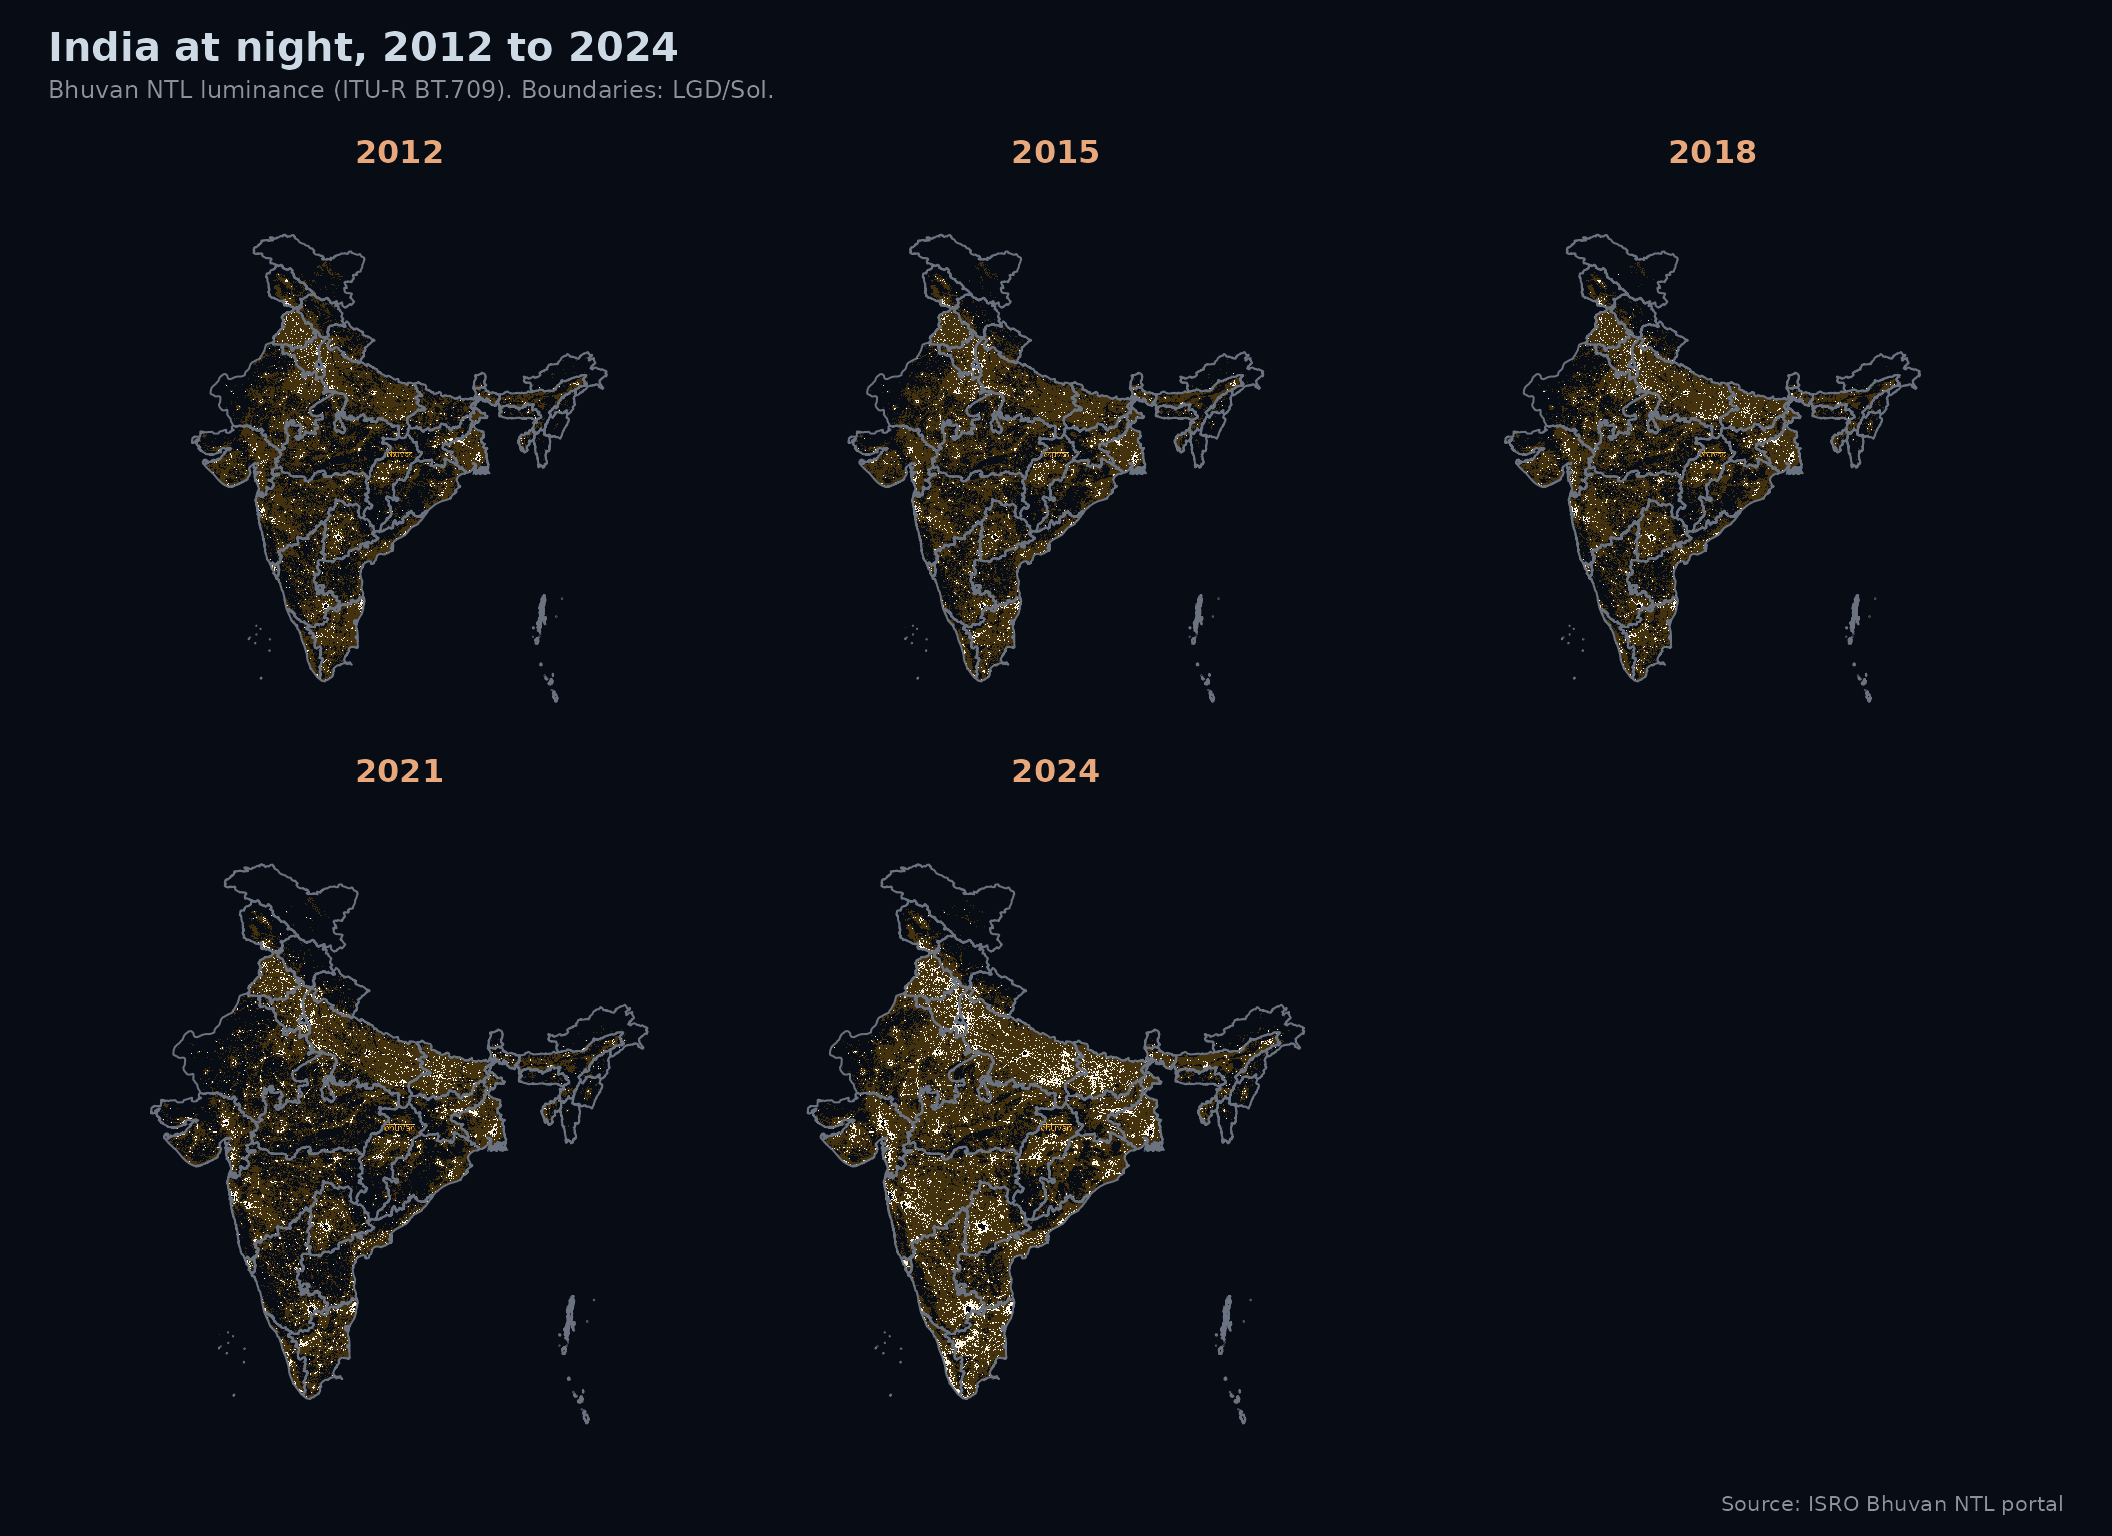
Each panel uses the same luminance scale anchored at zero, so brightness is comparable across years. The sharpest gains are in Bihar, UP, and Odisha after 2015, broadly tracking the Saubhagya electrification scheme (2017-2019).
Filter by year range
post_2015 <- bhuvan_stats(years = 2015:2024)
#> Warning: Your request spans a collection break in the Bhuvan NTL data:
#> 2012-2023 uses VNP46A4 Collection 1.0 and 2024 onwards uses Collection 2.0.
#> Radiance estimates are not directly comparable across this boundary. Treat any
#> 2023-to-2024 trend as an artefact of the collection change, not a real-world
#> signal.
nrow(post_2015)
#> [1] 370